Show HN by the Numbers: 188,000 Posts, 14 Years of Data, and What Actually Predicts GitHub Stars
Does it actually matter when you post your Show HN? And does a front-page run translate into GitHub stars? I scraped 188,085 Show HN posts and cross-referenced the top 500 with their GitHub star histories to find out.
TL;AI
- The median Show HN scores 2 points. If you hit 50, you’re in the top 6%.
- Best posting time: Monday 00:00 UTC (Sunday 7pm Eastern), with a 10.8% chance of scoring 50+.
- Each HN upvote converts to roughly 1.4 GitHub stars within 48 hours.
- The half-life of a Show HN is 24 hours. After 48h, 92% of the star impact is over.
- Show HN volume has nearly tripled since 2019 (28,000 posts in 2025). Your post now competes with ~200 others per day.
- HN score and GitHub stars correlate at r = 0.29. Significant, but your HN score explains only 8% of the variance in stars.
- Comments don’t predict stars (r = 0.10). Discussion doesn’t mean conversion.
The dataset
Every Show HN post from 2012 to April 2026, pulled from the HN Algolia API. 188,085 posts total, of which 51,338 (27%) link to a GitHub repo. For the GitHub correlation analysis, I fetched stargazer timestamps for 491 of the top 500 repos by HN score (all scoring 258+), using GitHub’s star-with-timestamps API.
Some caveats upfront. The Algolia API records final scores, not time-series, so I can’t tell you how long a post sat on the front page. The stargazer API caps at 1,000 stars per repo in my sampling window, which means the 48h star counts for very popular repos are underestimates. The dataset is biased toward high-scoring posts for the star analysis, since I couldn’t practically fetch star histories for all 51k repos.
With those limitations acknowledged, the patterns are clear enough to be useful.
Show HN is booming (and getting noisier)
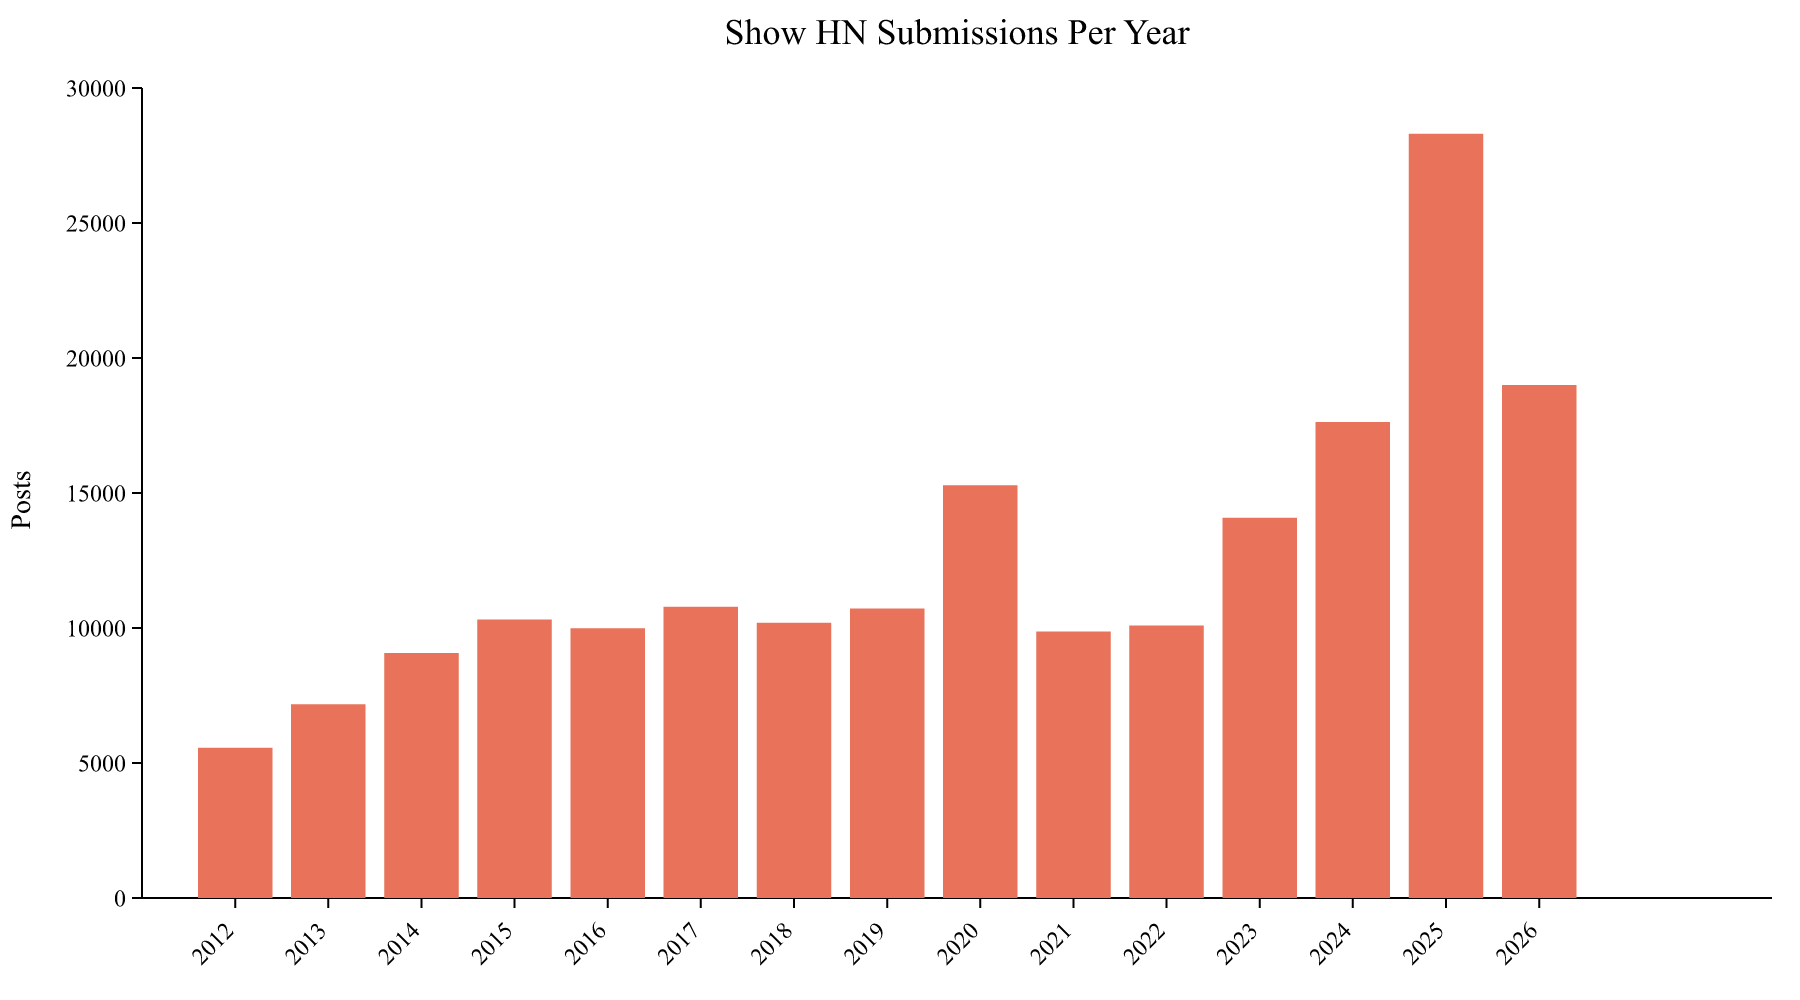
The most striking trend in the data isn’t about timing at all. Show HN submissions have exploded. From 2012 to 2019, the platform saw a steady ~10,000 Show HN posts per year. COVID lockdowns pushed this to 15,000 in 2020. Then came ChatGPT.
Starting in late 2022, submissions began climbing steadily, and 2025 hit 28,302 posts. That’s nearly a 3x increase from the pre-COVID baseline. Whether this is because more people are building things (thanks to AI-assisted development) or because more people are treating Show HN as a launch channel is hard to say. Probably both.
The practical implication: your Show HN is now competing with roughly 200 other Show HN posts on any given day, up from about 30 a decade ago. The signal-to-noise ratio has changed dramatically.
What “normal” looks like
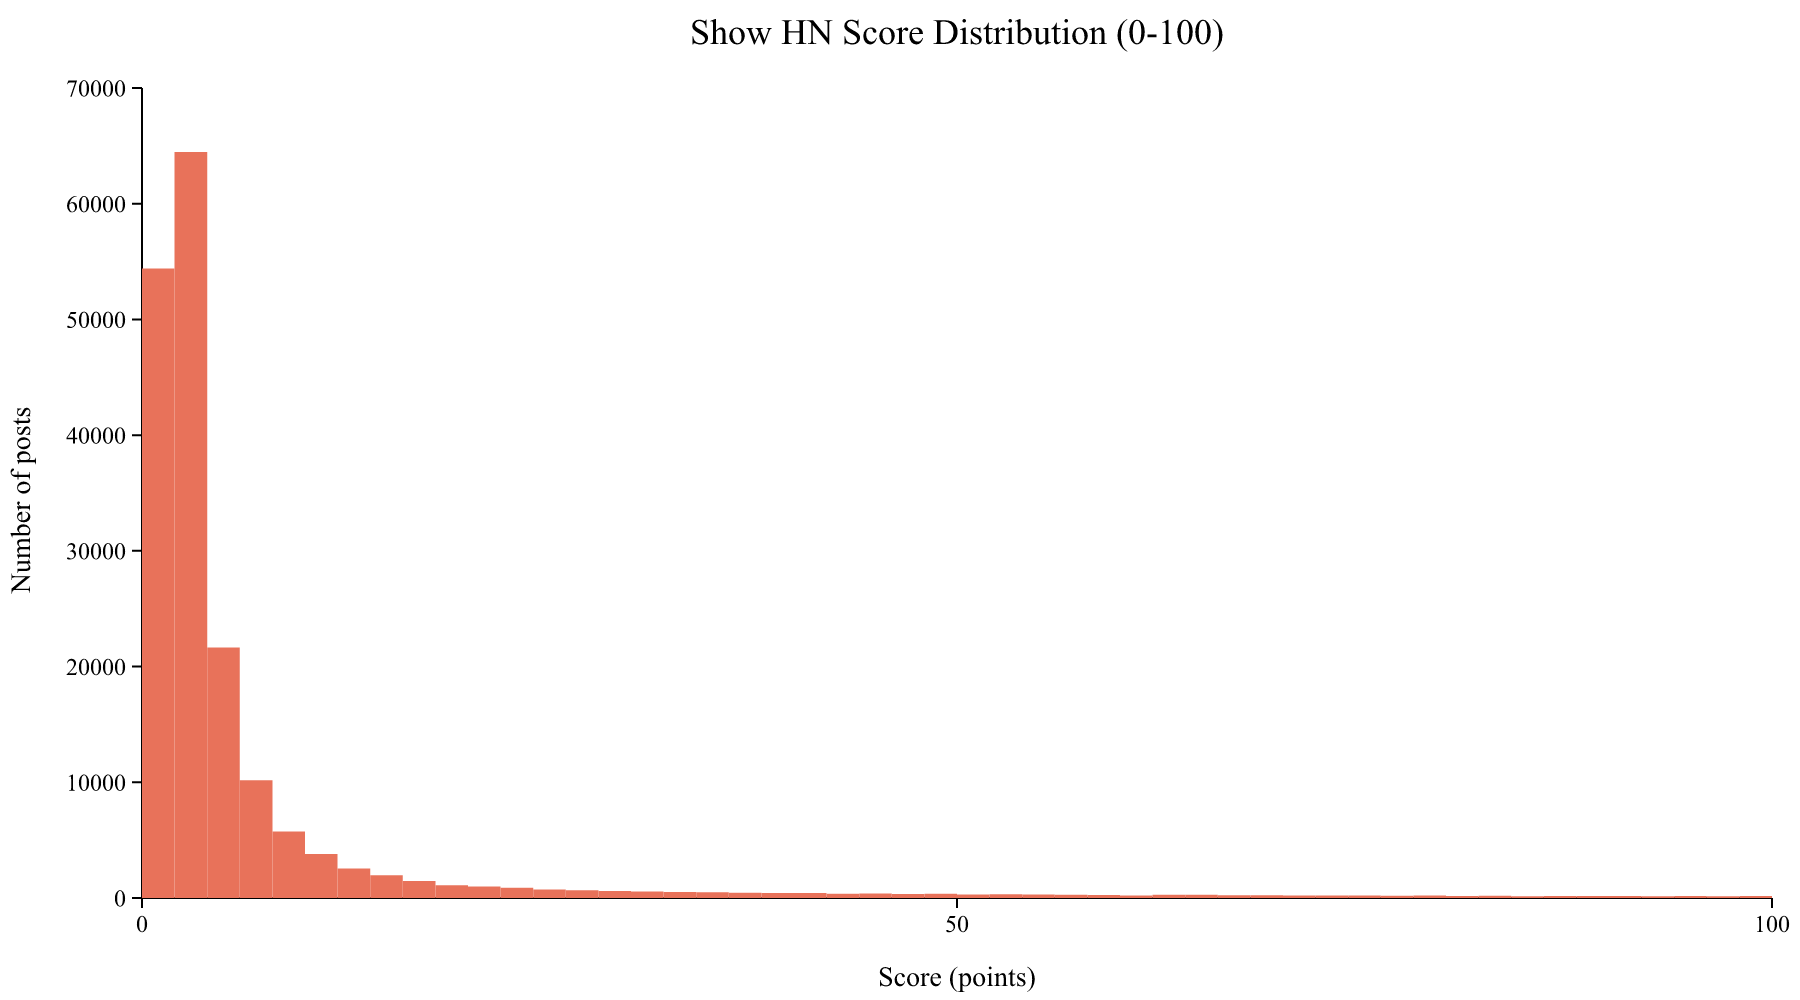
The median is 2, the 90th percentile is 24, and the 99th percentile is 263.
Before talking about what works, it helps to calibrate expectations. The median Show HN post scores 2 points. The mean is 13.5, dragged up by the long right tail.
If your Show HN gets 5 points, you’re already above average. If it hits 50, you’re in the top 6%. And if you crack 250, you’re in the top 1% of all Show HN posts ever submitted.
Most Show HN posts simply don’t gain traction. That’s not necessarily a reflection of quality. The new/rising page is a crowded, fast-moving queue, and a post can easily get buried in minutes if it doesn’t catch an early upvote or two.
When to post: the heatmaps
This is the question everyone asks, and I have both the expected answer and some surprises.
Where the scores are
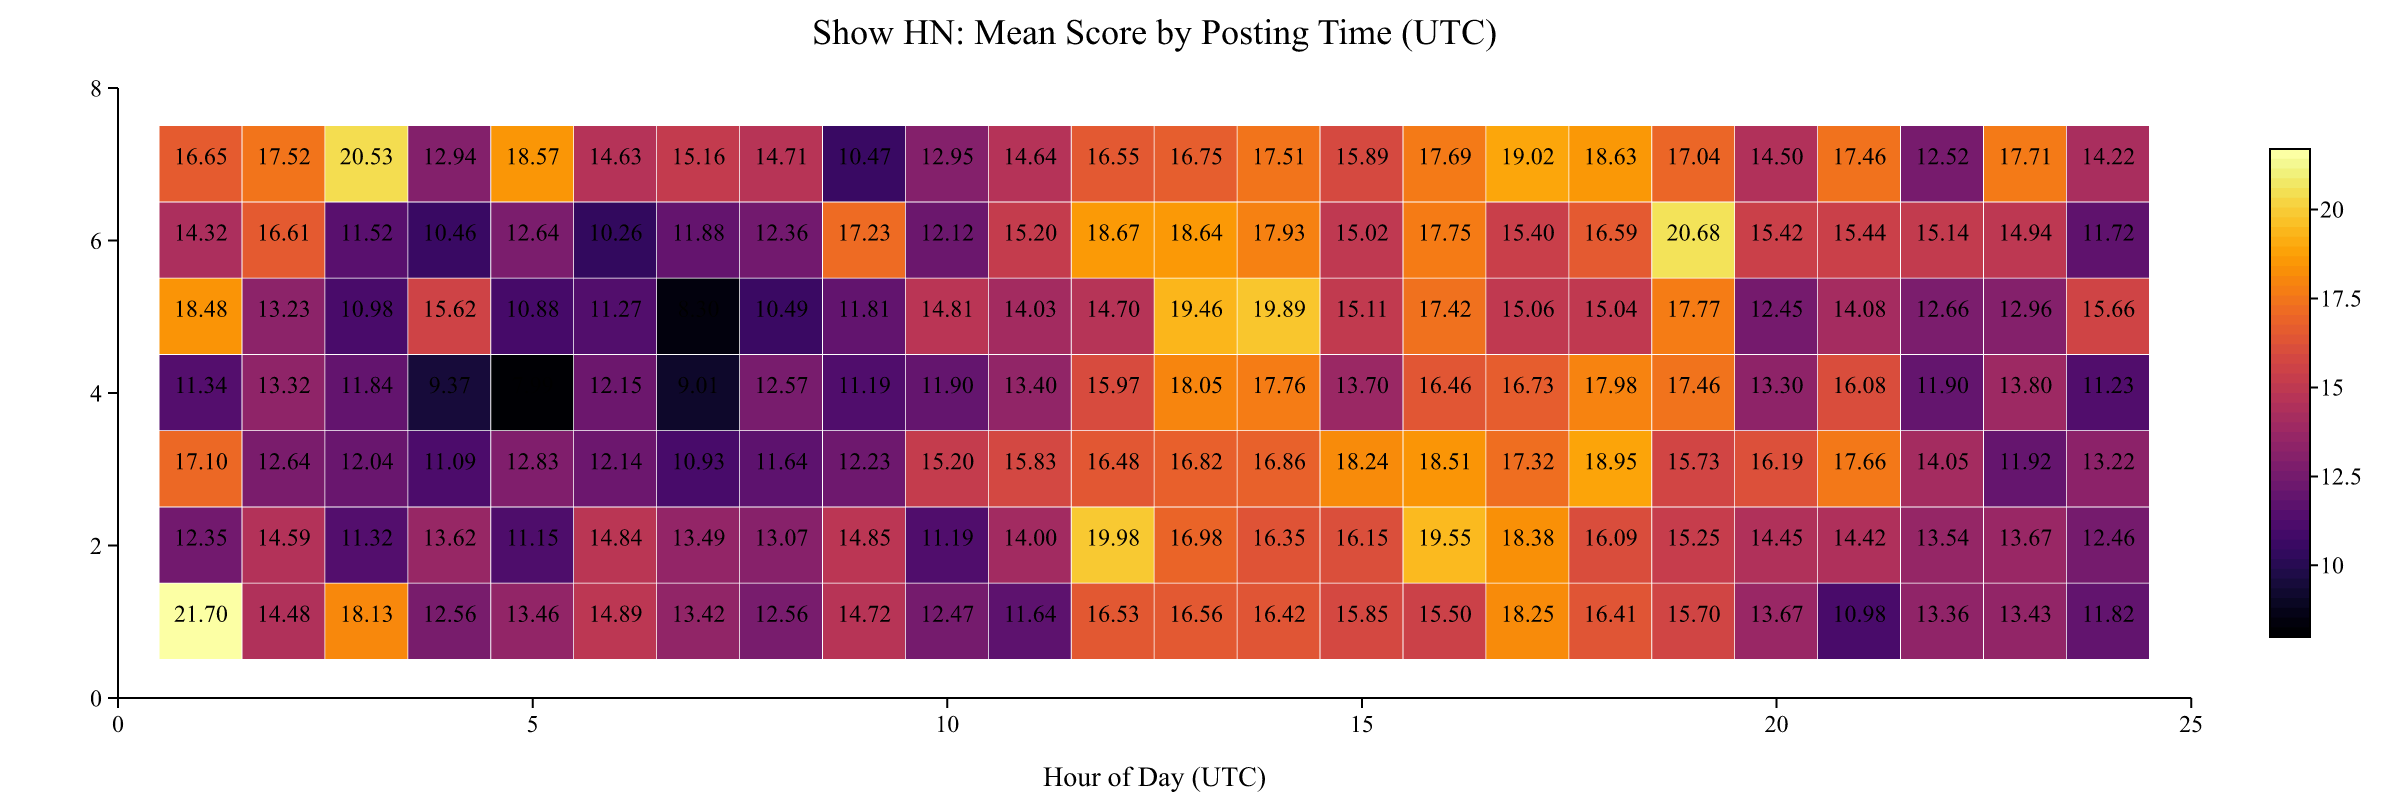
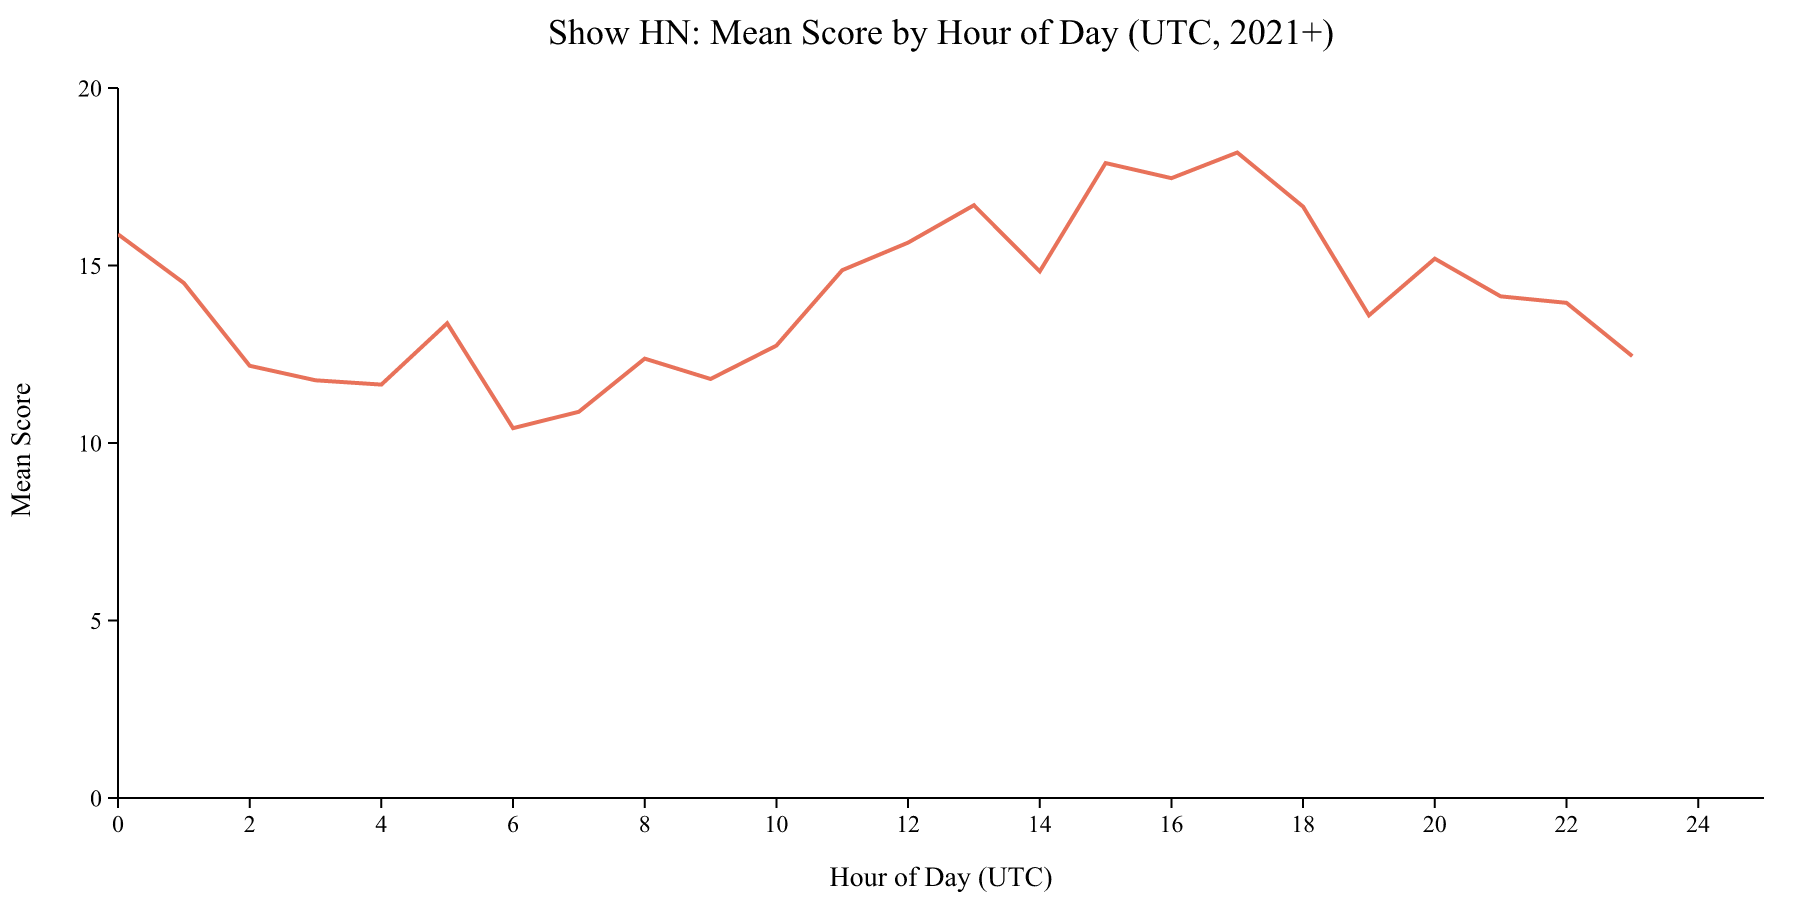
Mean scores show a pattern that differs from post volume. The highest mean scores cluster around 12:00 to 15:00 UTC (7-10am Eastern), which is just before the main wave of competition hits. Sunday morning UTC also performs well. Fridays at 12-15 UTC (mean 18.0) and Sundays at 16-19 UTC (17.3) are the best blocks.
Your actual odds
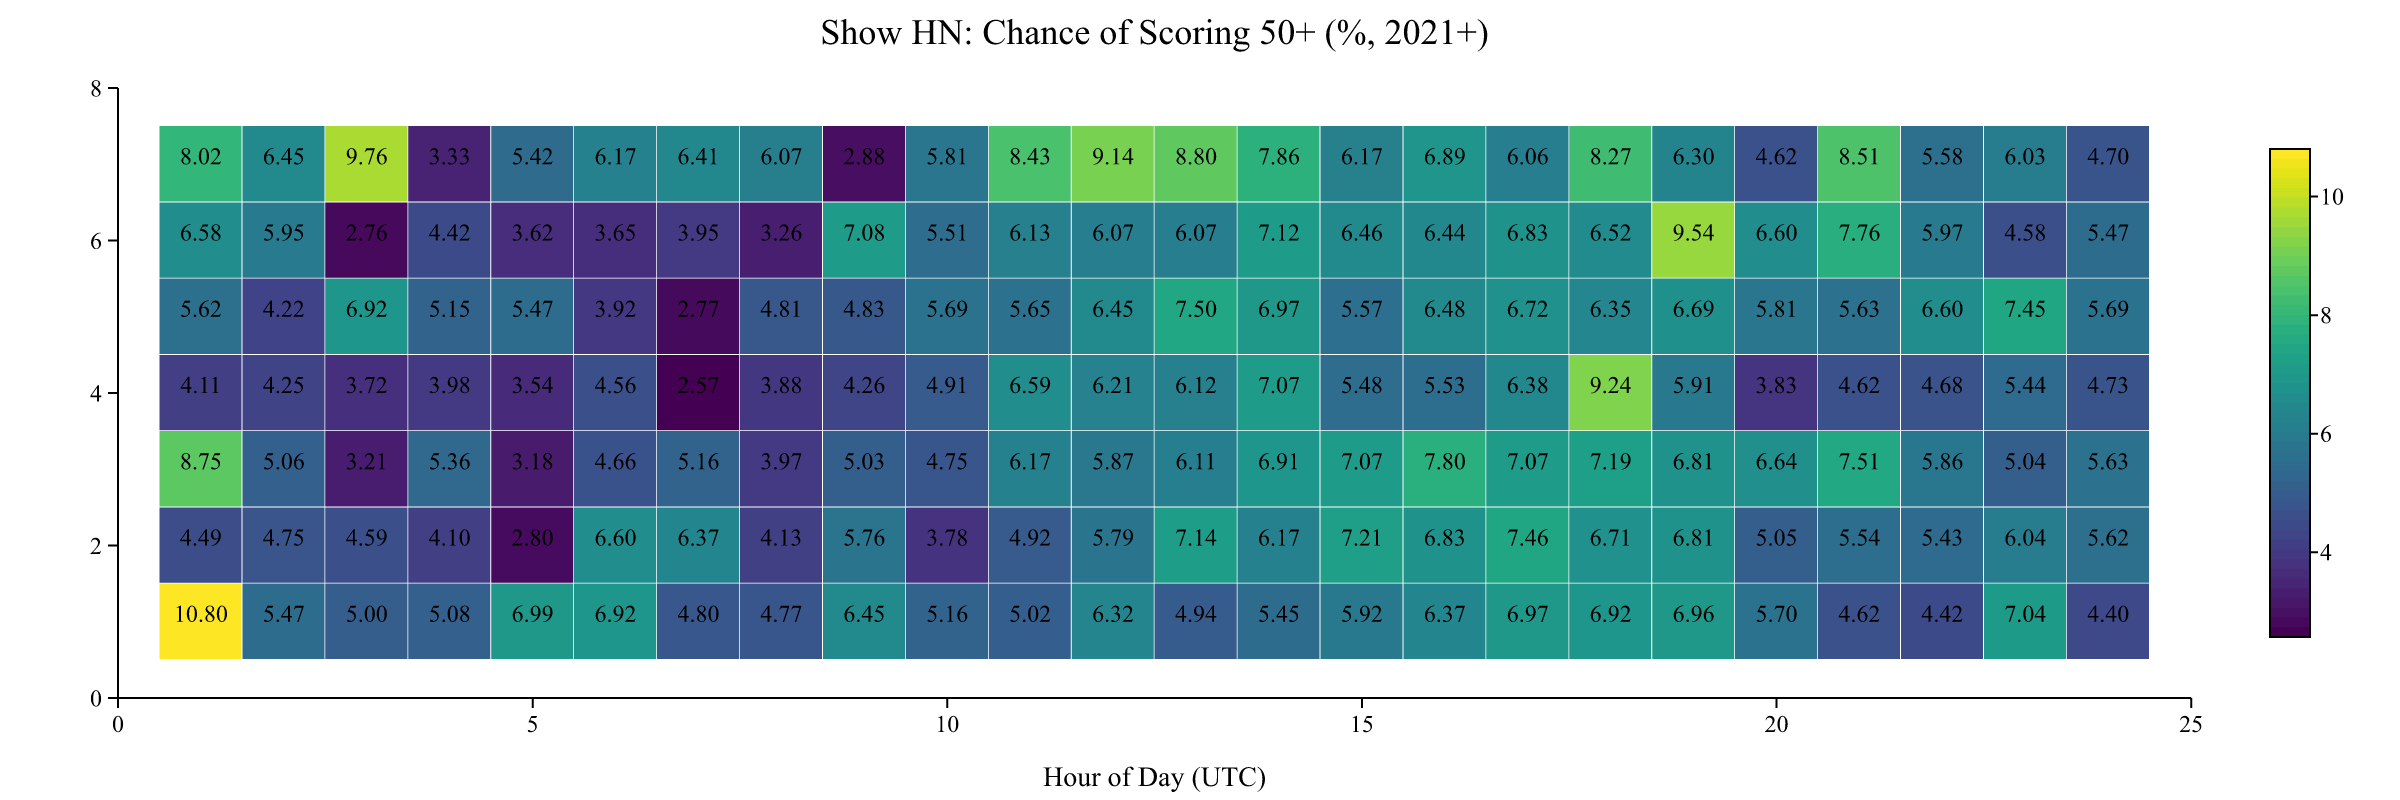
The best individual slot is Monday 00:00 UTC (10.8%). The worst is Thursday 06:00 UTC (2.6%).
The most actionable view: what percentage of posts at each timeslot score 50 or higher? (Recent data only, 2021 onwards.)
The best slot, by a significant margin, is Monday at 00:00 UTC (Sunday 7pm Eastern), where 10.8% of posts reach 50+. The worst slots are mid-week during the early UTC morning, particularly Thursday at 06:00 UTC (2.6%). This makes intuitive sense: you’re posting when the audience hasn’t yet arrived for the day.
Note that the 4-hour blocks above smooth out the granular peaks. The individual best hours are Monday 00:00 (10.8%), Sunday 02:00 (9.8%), and Saturday 19:00 (9.2%).
Score vs. competition
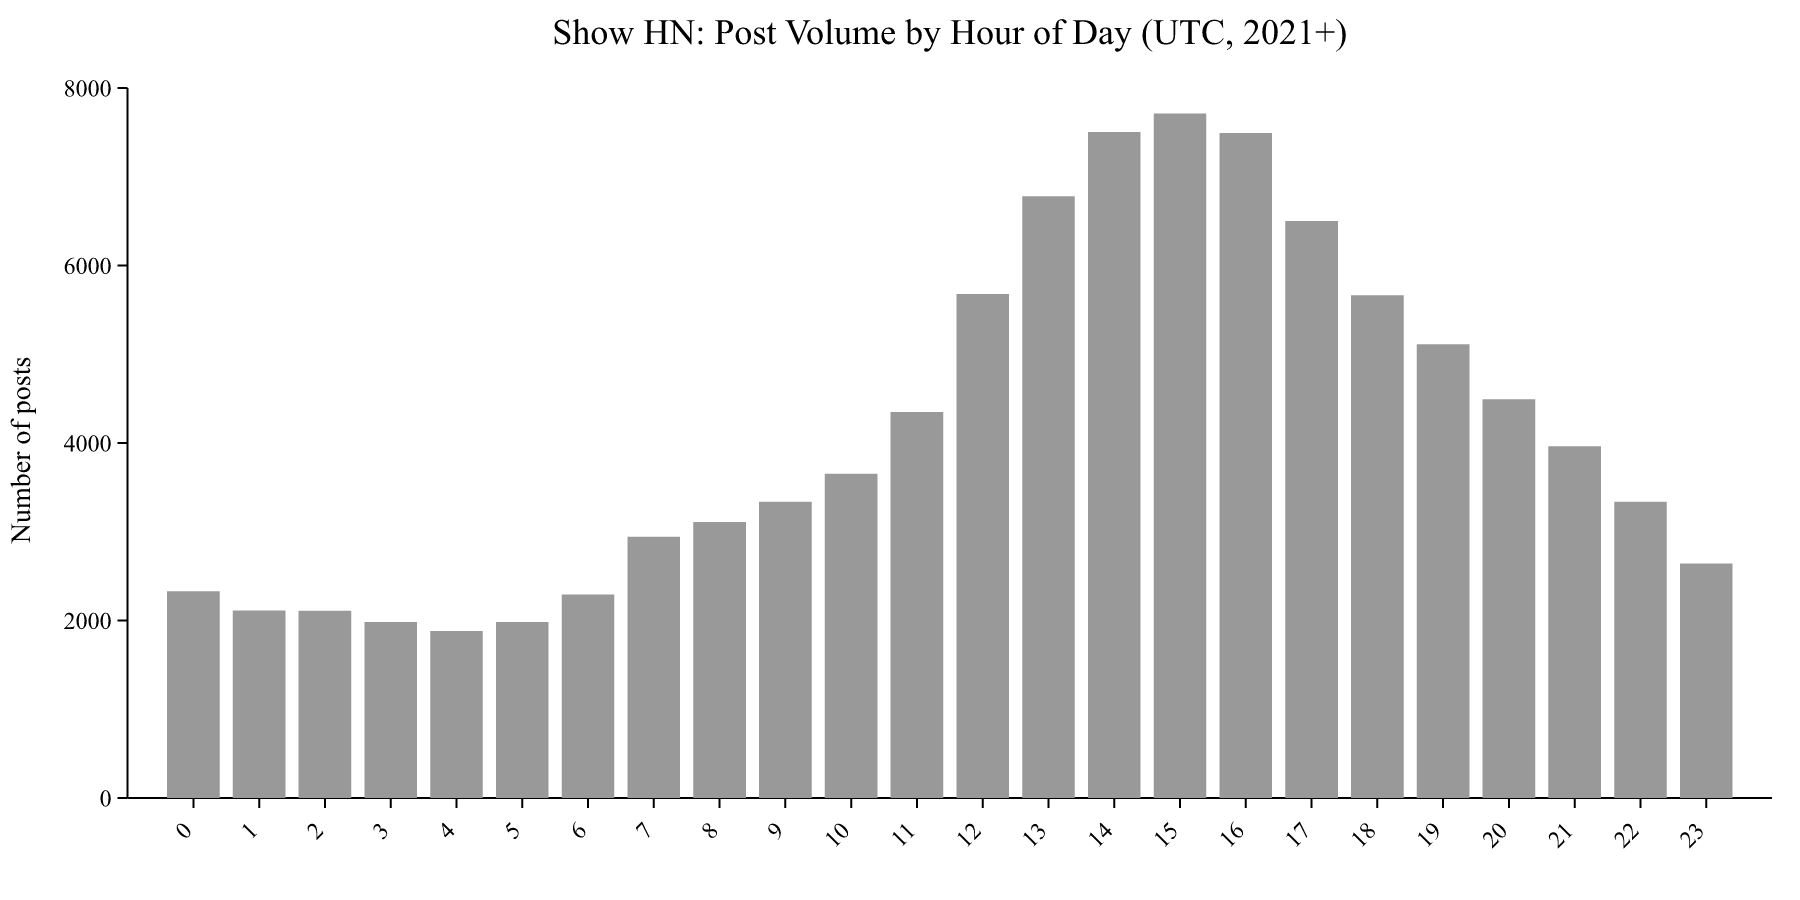
The gap between competition (post volume) and score is where the opportunity sits. The widest gap, where scores are high relative to competition, is around 00:00 to 01:00 UTC (US evening). The narrowest gap is around 15:00 UTC (US late morning), where both volume and scores peak together.
The takeaway: posting right at the start of the US workday (early morning Eastern) catches the audience as they’re arriving, before the day’s competition has accumulated.
The real question: does HN performance predict GitHub stars?
This is the analysis nobody else has done, and the answer is more nuanced than I expected.
The correlation
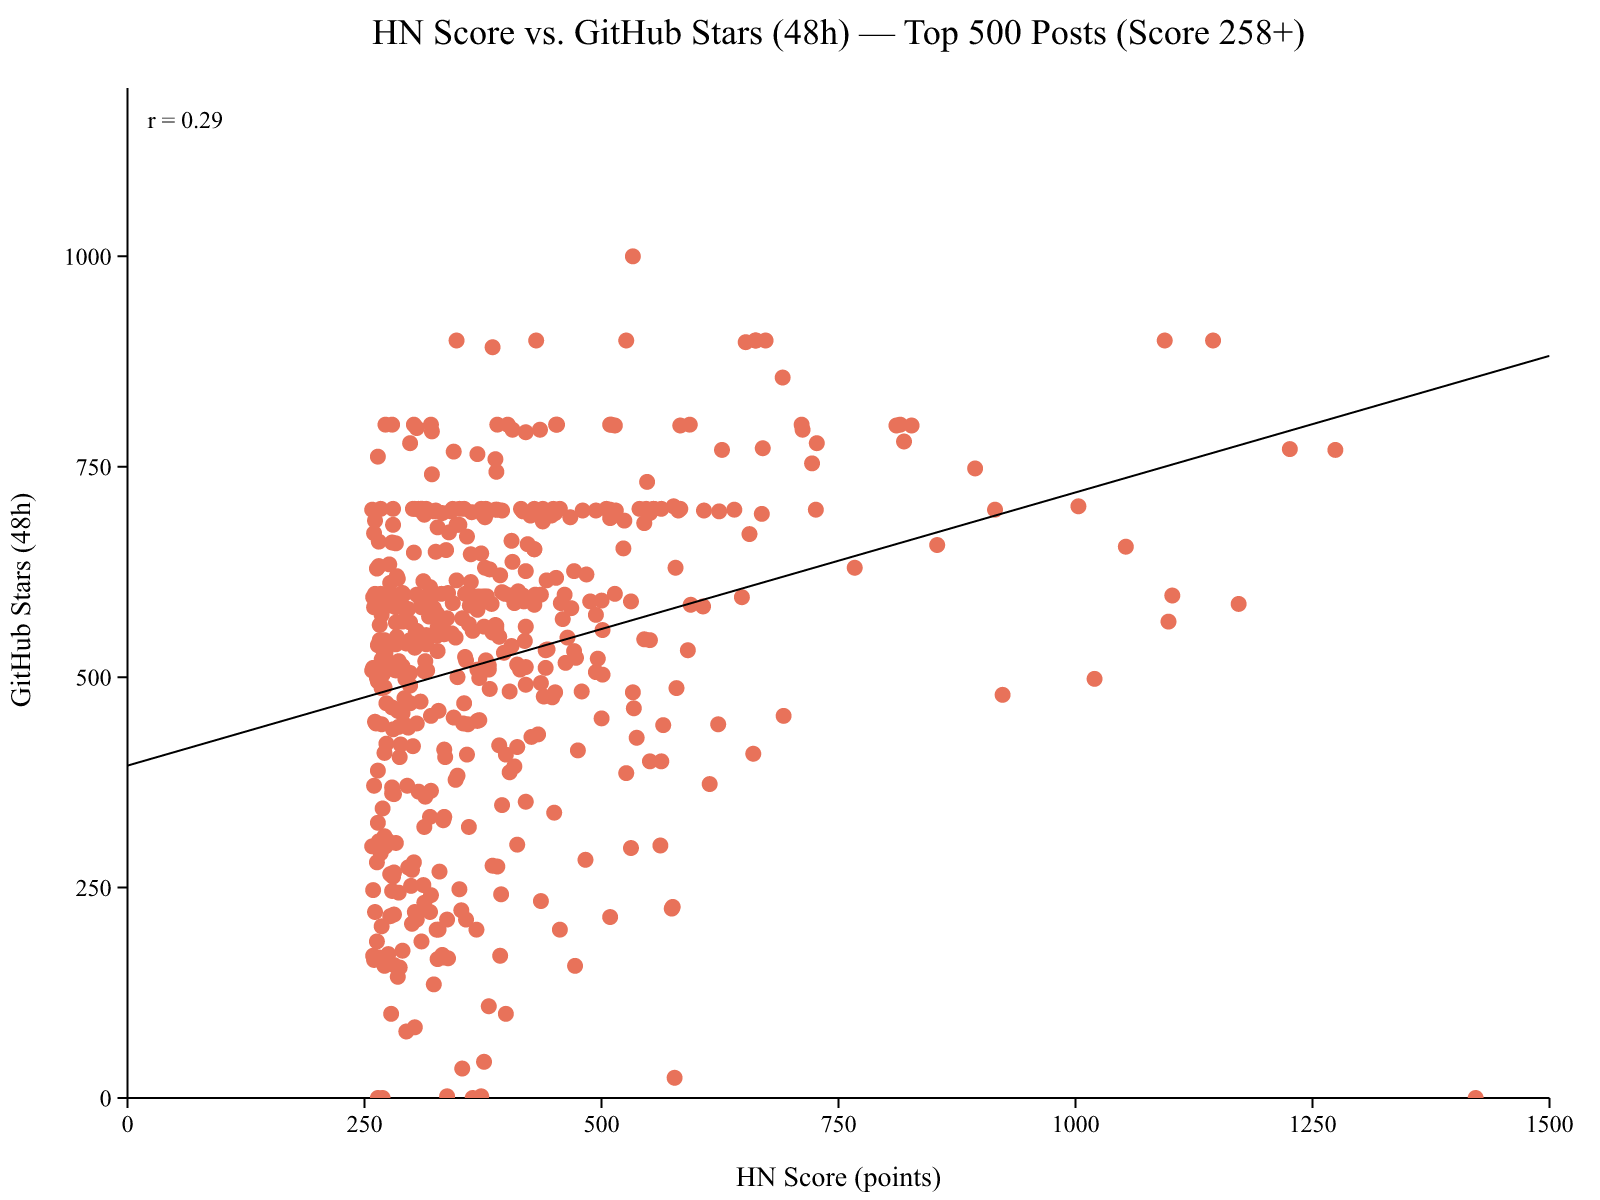
Overall correlation: r = 0.285 (p = 1.2e-10). Comments vs stars: r = 0.102 (p = 2.4e-02).
The correlation between HN score and GitHub stars gained in 48 hours is r = 0.29 (p < 0.001). Statistically significant, but modest. A higher HN score does predict more stars, but it explains only about 8% of the variance.
What’s interesting is the diminishing conversion rate. Posts scoring 258-350 average 1.77 stars per HN point. Posts scoring 700+ average only 0.79 stars per point. The relationship is sublinear: doubling your HN score does not double your GitHub impact.
Comments are an even weaker predictor (r = 0.10). A lively comment section on HN doesn’t mean people are heading to your repo to star it.
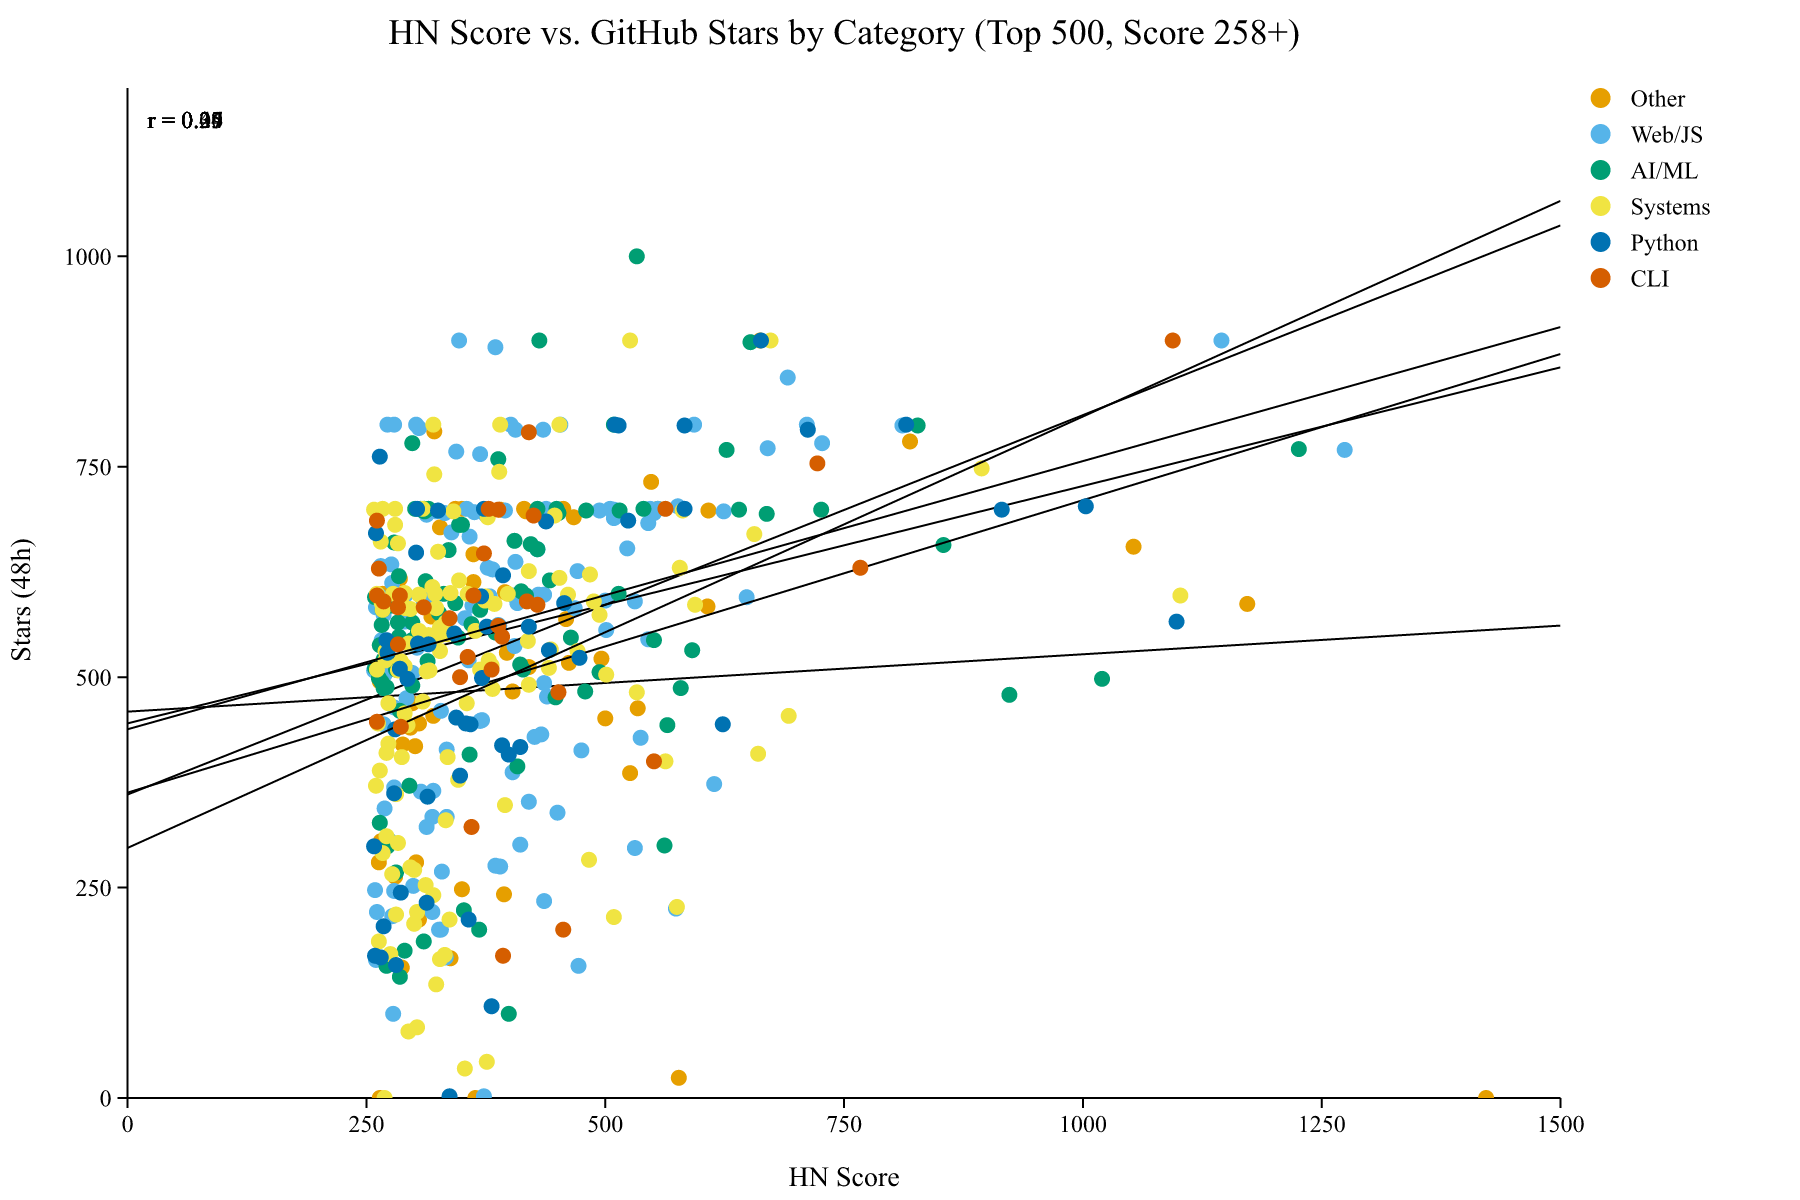
The conversion rate by category
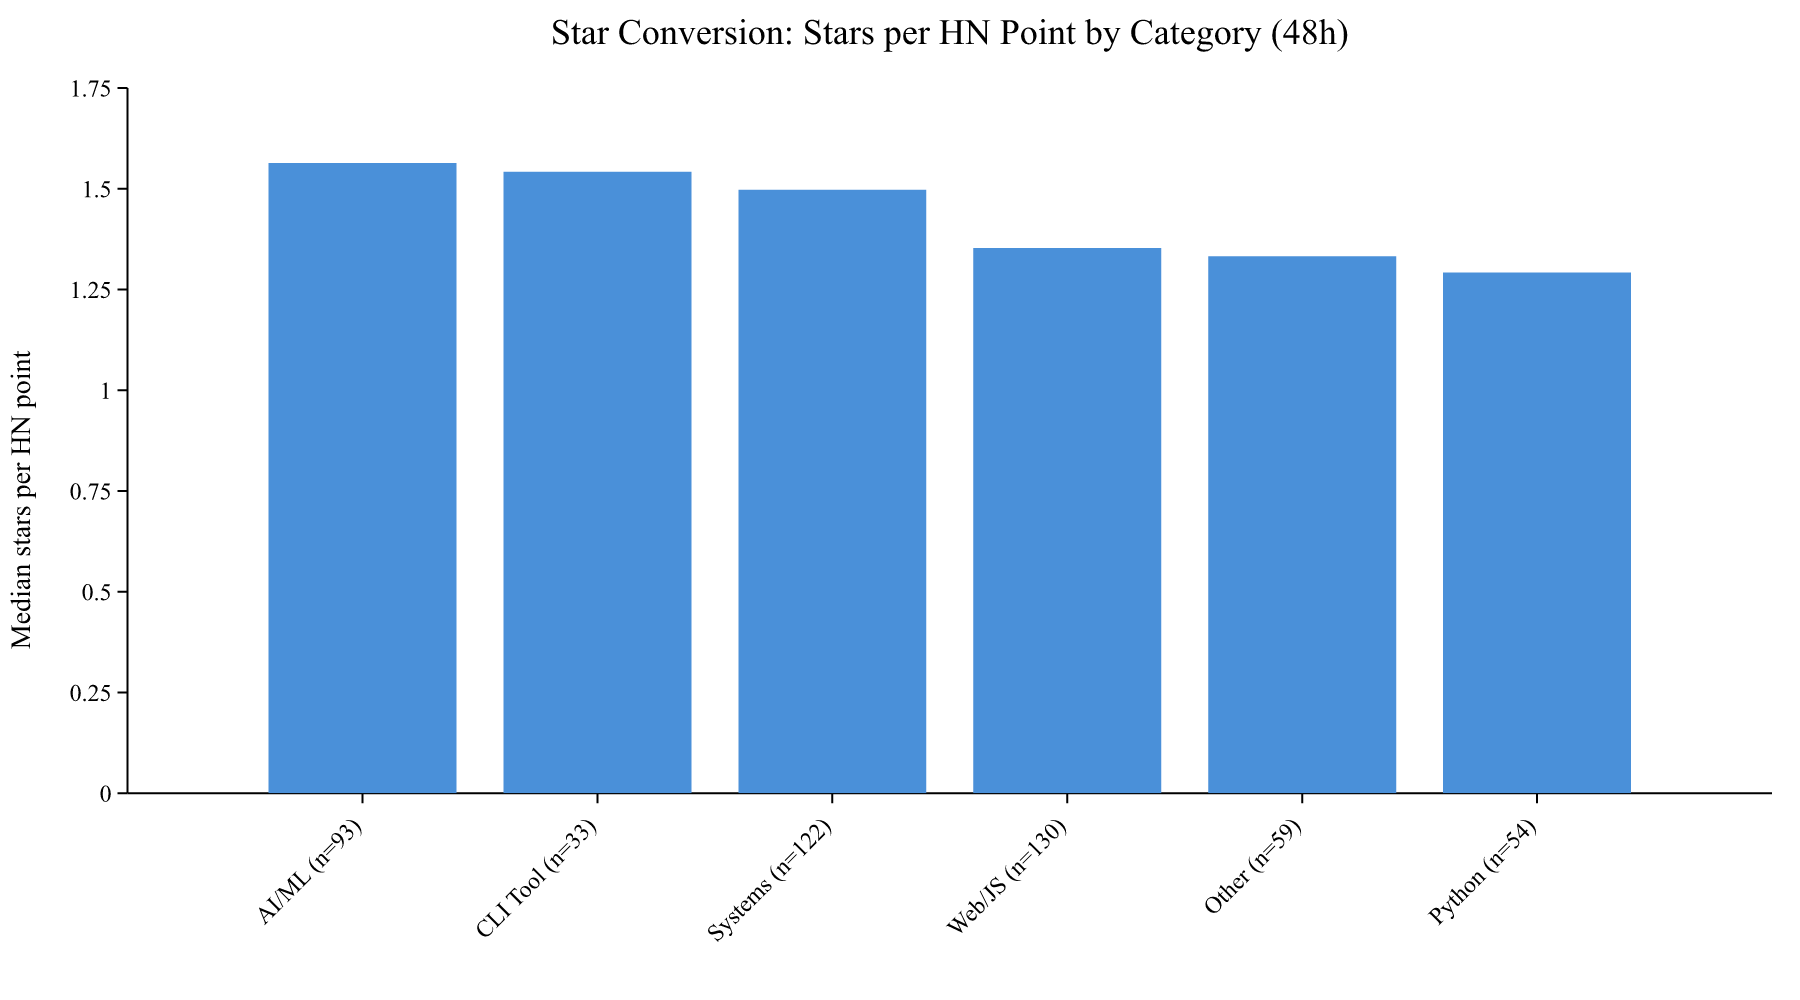
Each HN upvote translates to roughly 1.4 GitHub stars in the 48-hour window (median across all repos in the sample). AI/ML projects and CLI tools convert slightly better, perhaps because HN’s audience skews toward power users who star tools they might actually use. But the difference is small. The category of your project matters far less than simply getting upvotes.
The half-life of a Show HN
This is, to me, the most important finding in the entire analysis.
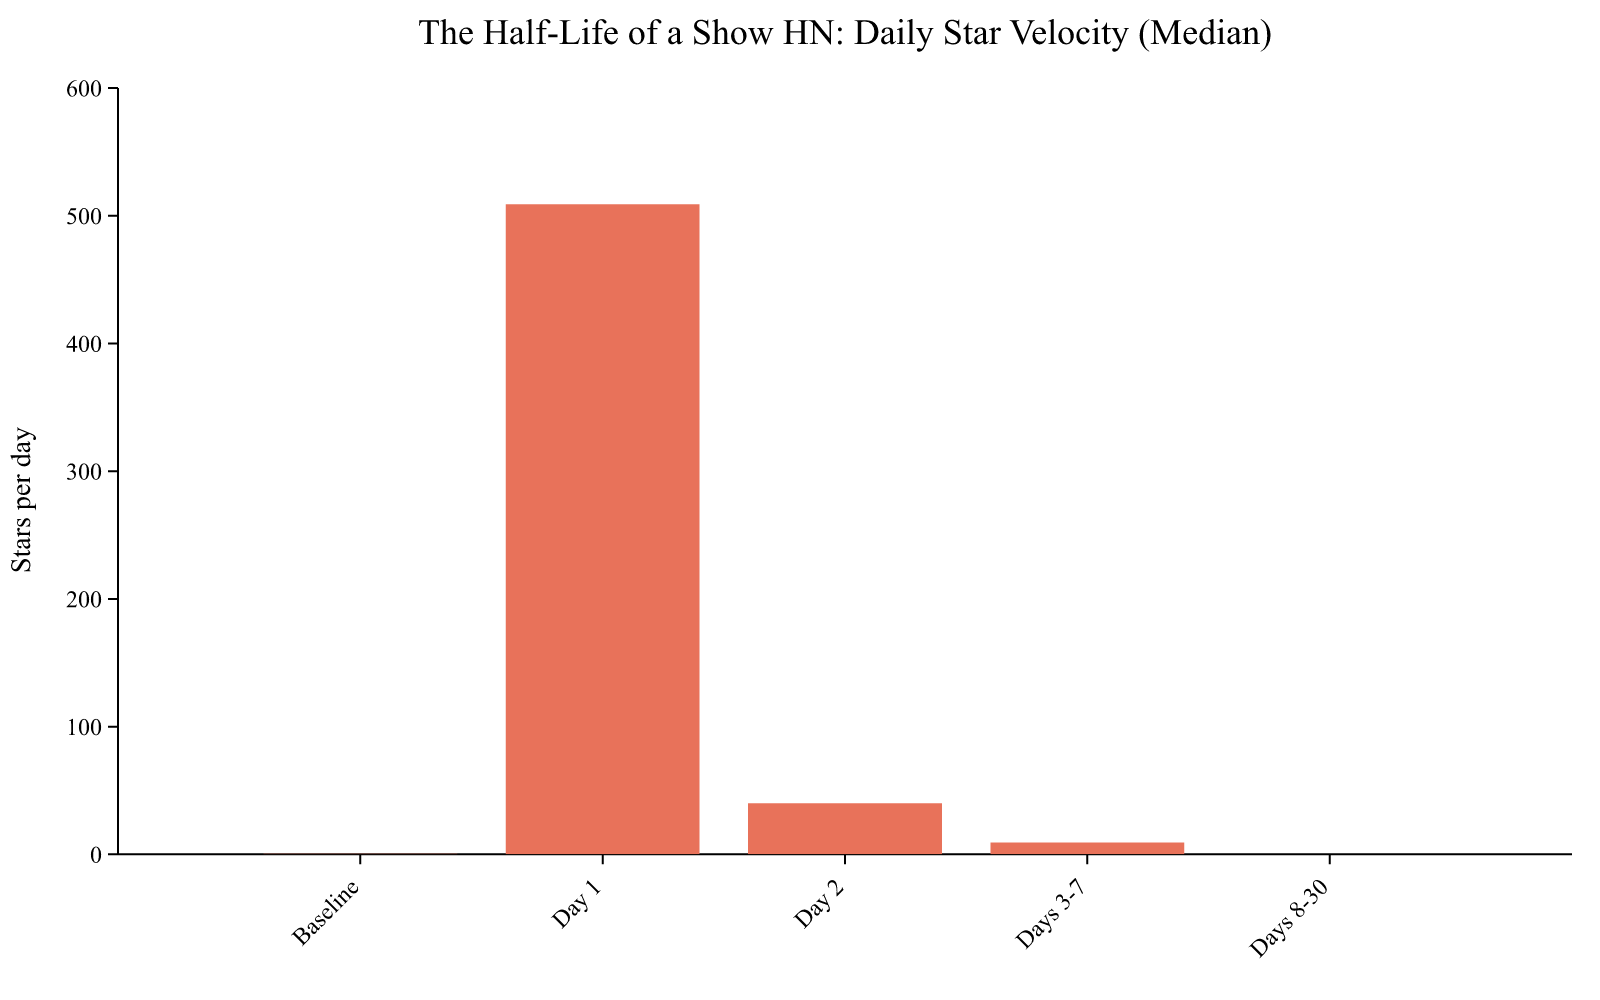
Day 1 spike: 1,188x baseline. After 48h, ~92% of star-getting is over.
The median successful Show HN project (scoring 258+) goes from 0.4 stars per day before posting to 509 stars on Day 1. That’s a 1,200x spike. By Day 2, it’s dropped to 40. By Days 3 through 7, it averages 9 per day. By Days 8 to 30, it’s back to zero.
The half-life of a Show HN bump is almost exactly 24 hours. After 48 hours, 92% of the star-getting is over. After a week, it’s done.
This has a practical consequence that I think is underappreciated. A Show HN launch is not a growth strategy. It’s a pulse. You get one day of intense attention, and then it’s over. If your project doesn’t have a growth flywheel beyond HN (SEO, word of mouth, integrations, a community), the stars you gain on Day 1 are essentially all you’re going to get from this channel.
Some of the most-starred repos in the sample (lazygit at 76k, pocketbase at 57k, nocodb at 62k) gained relatively few stars from their Show HN despite scoring 500+. Why? Because they already had growth engines running. The Show HN was a blip in their overall trajectory, not the main driver.
What this means for your launch
If you’re planning a Show HN, here’s what the data actually supports:
1. Post on Sunday evening or Monday morning (US time). The success rate is highest at Monday 00:00 UTC (Sunday 7pm Eastern). Sunday posts generally face less competition and have more time to accumulate upvotes before the Monday rush.
2. Expect roughly 1.4 GitHub stars per HN upvote. If you hit 100 points, plan for ~100 to 150 stars. If you hit 500, maybe 500 to 700. This is a useful mental model for setting realistic expectations.
3. Your window is 24 hours, not 48. The vast majority of the star impact happens on Day 1. Make sure your repo’s README, demo, and documentation are polished before you post, not after.
4. Comments don’t predict stars. A spirited comment section is fun, but it doesn’t correlate with people actually visiting your repo. Don’t mistake engagement for conversion.
5. The HN channel is getting noisier. With 200+ Show HN posts per day in 2026 (up from 30 a decade ago), the base rate for success keeps dropping. Treat Show HN as one launch channel among several, not your entire go-to-market strategy.
Methodology notes
Data source: HN Algolia API (hn.algolia.com/api/v1), queried with the show_hn,story tag filter. Paginated by month with recursive time-window splitting to stay within the API’s 1,000-result limit per query.
GitHub data: Star timestamps fetched via the GitHub API’s application/vnd.github.v3.star+json accept header for 491 of the top 500 repos by HN score (all scoring 258+). For repos with more than 1,000 stars, binary search was used to find the page window around the HN post date, then surrounding pages were fetched. This means the 48h star count is accurate for repos with fewer than ~1,000 stars in that window, and a lower bound for larger repos.
Time period: January 2012 to April 2026 for the full dataset. Timing analysis (success rate heatmap) uses 2021 onwards for relevance.
Code: Analysis scripts are Python, using pandas and scipy. Charts generated with kuva, a scientific plotting CLI by James Ferguson. Available on request.
I’m Dan King, and I built this analysis after posting my own Show HN for Burnish, an MCP protocol renderer. It scored 1 point. No traction, no front page, no star bump. I’m part of the 29%. That’s what motivated the analysis: I wanted to know whether I’d done something wrong, or whether this is just what the distribution looks like. Turns out, it’s mostly the distribution.